Code
from scipy.stats import norm
import matplotlib.pyplot as plt
import numpy as np

x = np.linspace(norm.ppf(0.001), norm.ppf(0.999), 100)
y = norm.pdf(x)
plt.plot(x, y)
_ = plt.title("pdf for Normal distribution (0, 1)")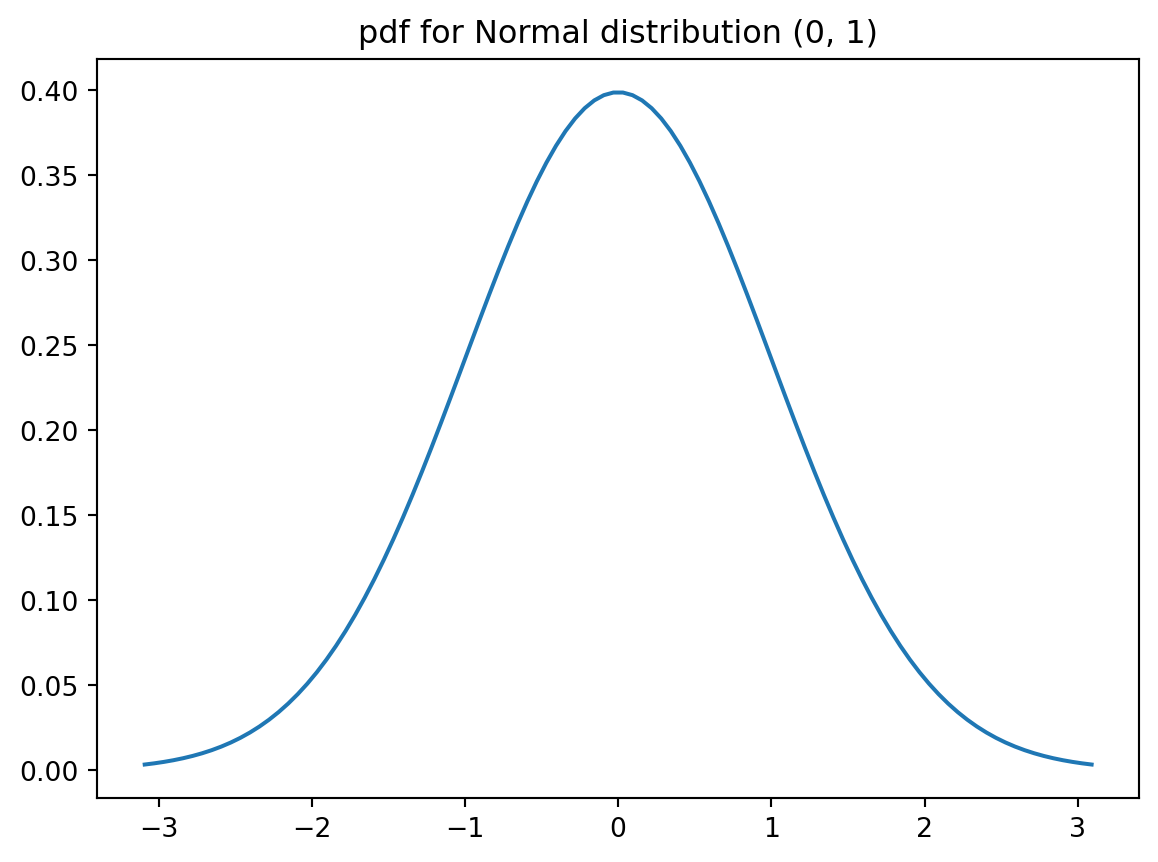
\[ \require{physics} \require{braket} \]
\[ \newcommand{\dl}[1]{{\hspace{#1mu}\mathrm d}} \newcommand{\me}{{\mathrm e}} \]
\[ \newcommand{\Exp}{\operatorname{E}} \newcommand{\Var}{\operatorname{Var}} \newcommand{\Mode}{\operatorname{mode}} \]
\[ \newcommand{\pdfbinom}{{\tt binom}} \newcommand{\pdfbeta}{{\tt beta}} \newcommand{\pdfpois}{{\tt poisson}} \newcommand{\pdfgamma}{{\tt gamma}} \newcommand{\pdfnormal}{{\tt norm}} \newcommand{\pdfexp}{{\tt expon}} \]
\[ \newcommand{\distbinom}{\operatorname{B}} \newcommand{\distbeta}{\operatorname{Beta}} \newcommand{\distgamma}{\operatorname{Gamma}} \newcommand{\distexp}{\operatorname{Exp}} \newcommand{\distpois}{\operatorname{Poisson}} \newcommand{\distnormal}{\operatorname{\mathcal N}} \]
\[ \distnormal(x; \mu, \sigma^2) \]
posterior mean: \[ \frac{n}{n+\frac{\sigma_0^2}{s_0^2}}\overline{X}+\frac{\frac{\sigma_0^2}{s_0^2}}{n+\frac{\sigma_0^2}{s_0^2}}m. \]
We use the norm object from scipy.stats package.
scipy.stats.norm(loc=mean, scale=standard_deviation) is to intialize a normal distribution object.pdf(): probablitiy distribution function, both inputs and outputs are numpy arrays.cdf(): cumulative distribution function, both inputs and outputs are numpy arrays.interval(confidence, loc=0, scale=1): confidence interval.ppf(): Percent point function (inverse of cdf), both inputs and outputs are numpy arrays.rvs(size=1): random samplings.from scipy.stats import norm
import matplotlib.pyplot as plt
import numpy as np
x = np.linspace(norm.ppf(0.001), norm.ppf(0.999), 100)
y = norm.pdf(x)
plt.plot(x, y)
_ = plt.title("pdf for Normal distribution (0, 1)")
from scipy.stats import norm
import matplotlib.pyplot as plt
import numpy as np

x = np.linspace(norm.ppf(0.001), norm.ppf(0.999), 100)
y = norm.cdf(x)
plt.plot(x, y)
_ = plt.title("cdf for Normal distribution (0, 1)")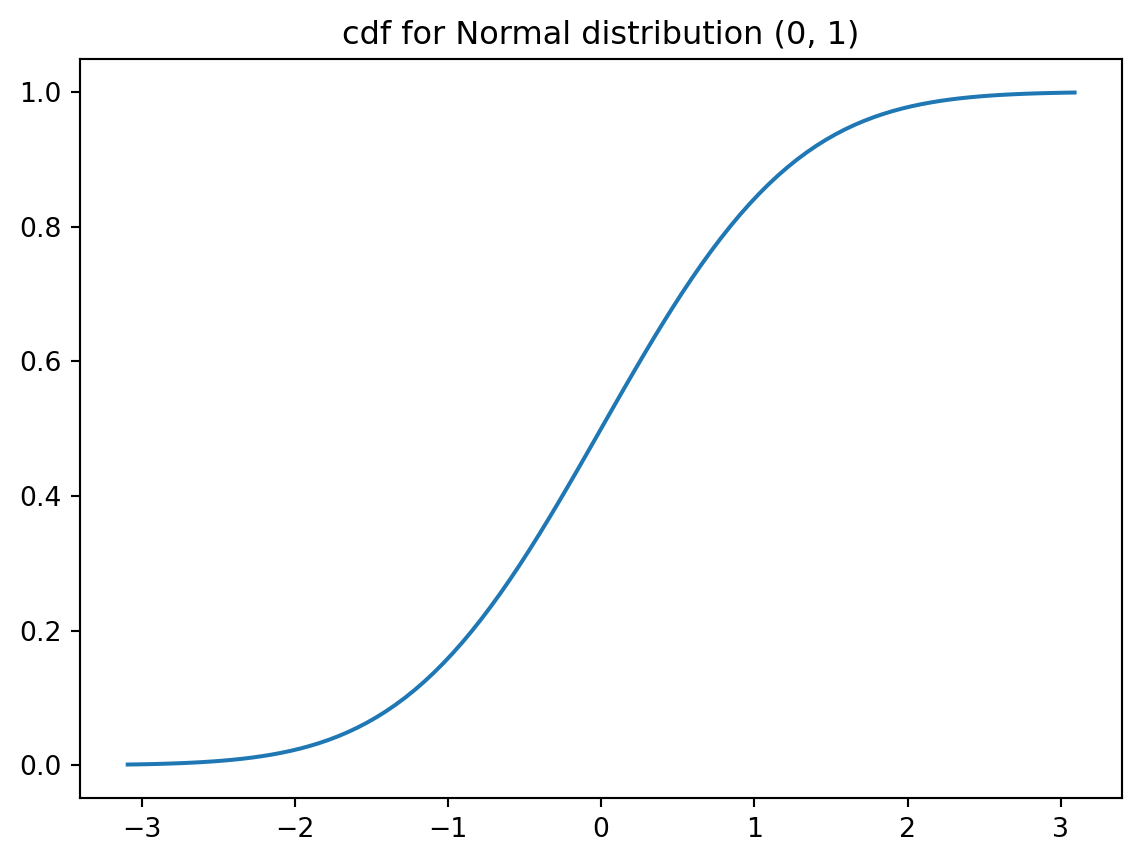
from scipy.stats import norm
import matplotlib.pyplot as plt
import numpy as np

x = np.linspace(norm.ppf(0.001), norm.ppf(0.999), 100)
y = norm.pdf(x)
plt.plot(x, y)

samples = norm.rvs(size=1000)
plt.hist(samples, bins=20, density=True)
_ = plt.title("histogram of random samplings for Normal distribution (0, 1)")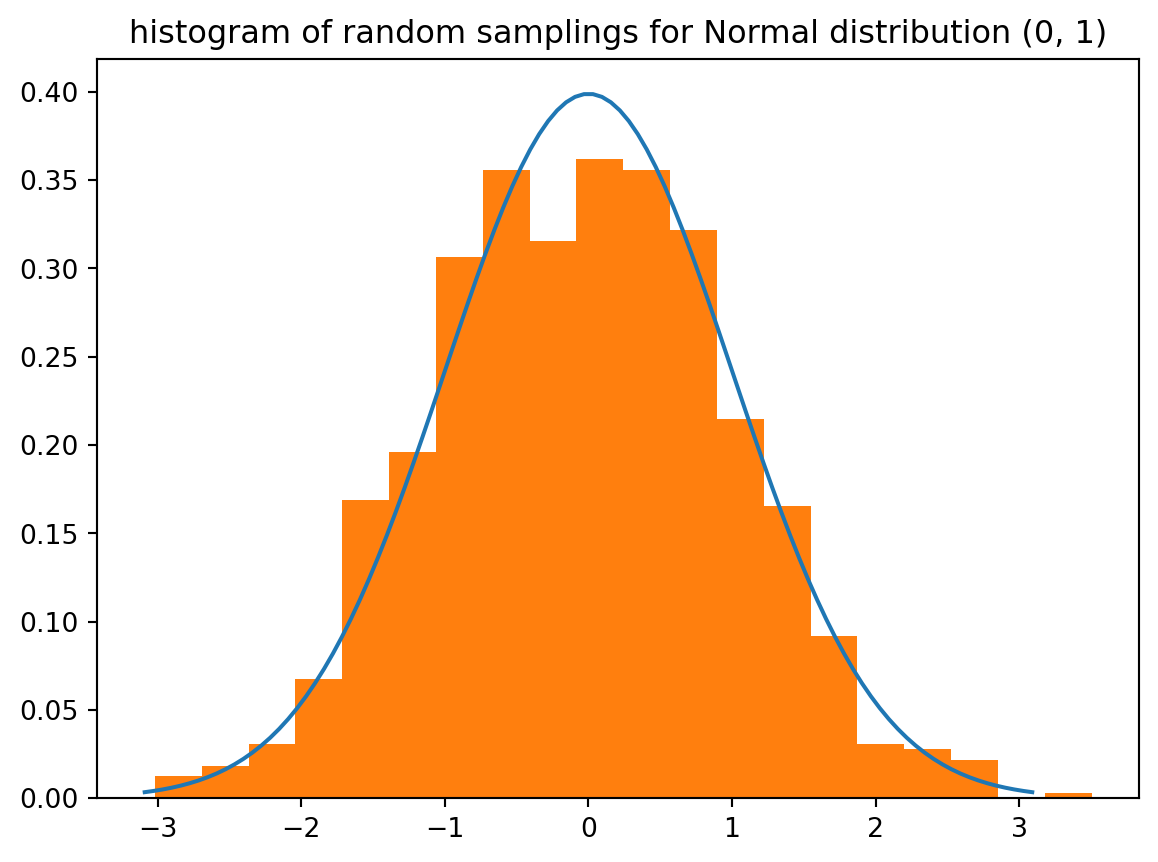
safljsdf