k-Nearest Neighbors Algorithm (k-NN)
Contents
2.1. k-Nearest Neighbors Algorithm (k-NN)#
2.1.1. Ideas#
Assume that we have a set of labeled data \(\{(X_i, y_i)\}\) where \(y_i\) denotes the label. Given a new data \(X\), how do we determine the label of it?
k-NN algorithm starts from a very straightforward idea. We use the distances from the new data point \(X\) to the known data points to identify the label. If \(X\) is closer to \(y_i\) points, then we will label \(X\) as \(y_i\).
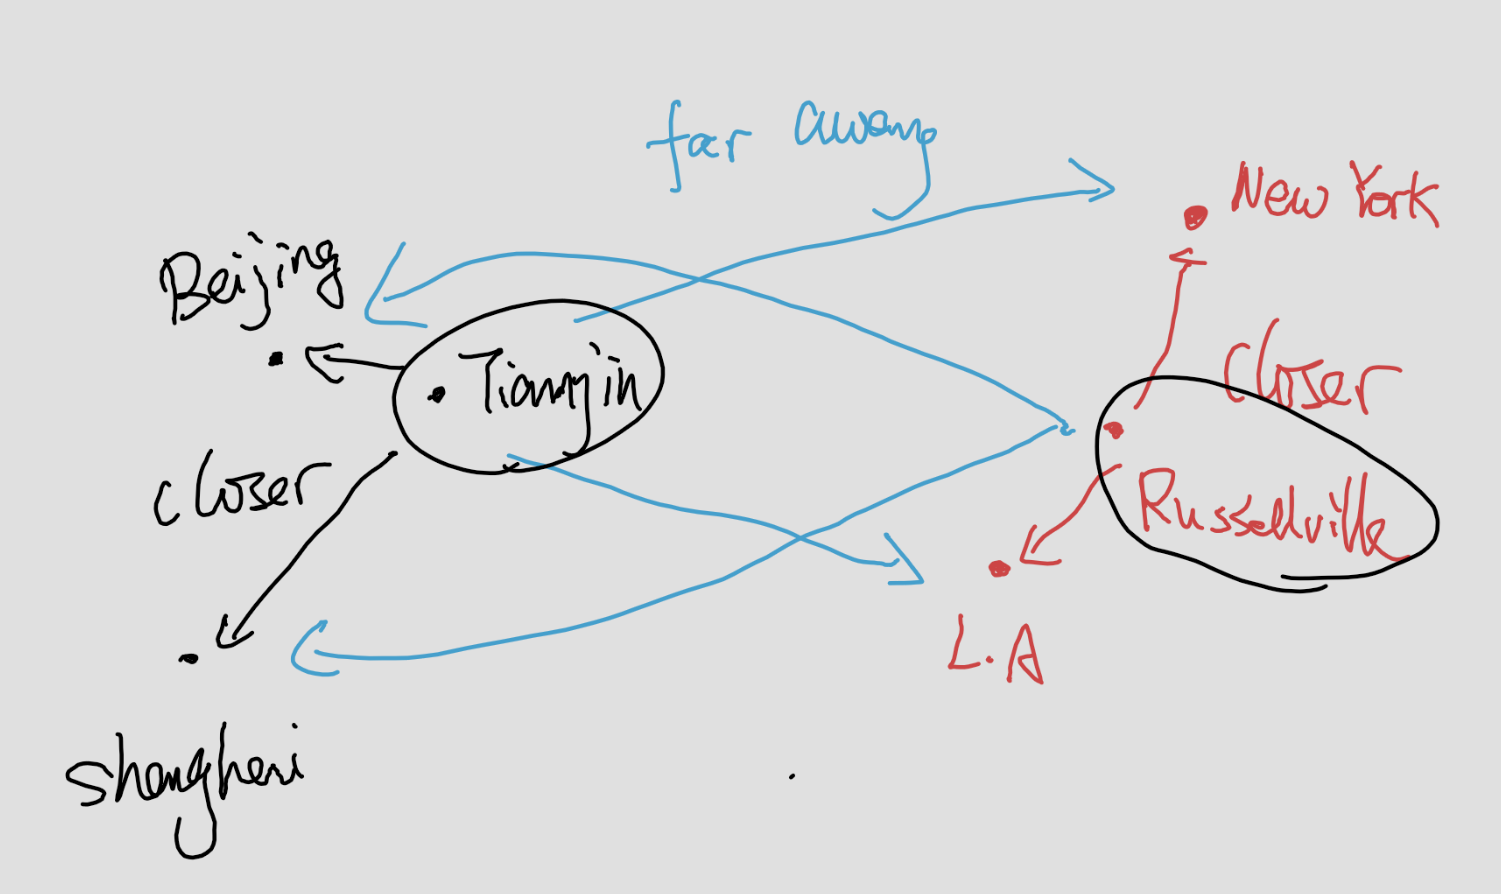
Let us take cities and countries as an example. New York and Los Angeles are U.S cities, and Beijing and Shanghai are Chinese cities. Now we would like to consider Tianjin and Russellville. Do they belong to China or U.S? We calculate the distances from Tianjin (resp. Russellville) to all four known cities. Since Tianjin is closer to Beijing and Shanghai comparing to New York and Los Angeles, we classify Tianjin as a Chinese city. Similarly, since Russellville is closer to New York and Los Angeles comparing to Beijing and Shanghai, we classify it as a U.S. city.
This naive example explains the idea of k-NN. Here is a more detailed description of the algorithm.
2.1.2. The Algorithm#
Algorithm 2.1 (k-NN Classifier)
Inputs Given the training data set \(\{(X_i, y_i)\}\) where \(X_i=(x_i^1,x_i^2,\ldots,x_i^n)\) represents \(n\) features and \(y_i\) represents labels. Given a new data point \(\tilde{X}=(\tilde{x}^1,\tilde{x}^2,\ldots,\tilde{x}^n)\).
Outputs Want to find the best label for \(\tilde{X}\).
Compute the distance from \(\tilde{X}\) to each \(X_i\).
Sort all these distances from the nearest to the furthest.
Find the nearest \(k\) data points.
Determine the labels for each of these \(k\) nearest points, and compute the frenqucy of each labels.
The most frequent label is considered to be the label of \(\tilde{X}\).
2.1.3. Details#
The distance between two data points are defined by the Euclidean distance:
Using linear algebra notations:
All the distances are stored in a \(1\)-dim numpy array, and we will combine it together with another \(1\)-dim array that store the labels of each point.
2.1.4. The codes#
argsortgetsorted
def classify_kNN(inX, X, y, k):
    # create a new 2-d numpy array by copying inX for each row.
    Xmat = np.tile(np.array([inX]), (X.shape[0], 1))
    # compute the distance between each row of X and Xmat
    Dmat = np.sqrt(np.sum((Xmat - X)**2, axis=1))
    # sort by distance
    sortedlist = Dmat.argsort()
    # count the freq. of the first k items
    k = min(k, len(sortedlist))
    classCount = dict()
    for i in sortedlist[:k]:
        classCount[y[i]] = classCount.get(y[i], 0) + 1
    # find out the most freqent one
    sortedCount = sorted(classCount.items(), key=lambda x:x[1],
                         reverse=True)
    return sortedCount[0][0]
2.1.5. sklearn packages#
You may also directly use the kNN function KNeighborsClassifier packaged in sklearn.neighbors. You may check the description of the function online from here.
There are many ways to modify the kNN algorithm. What we just mentioned is the simplest idea. It is correspondent to the argument weights='uniform', algorithm='brute and metric='euclidean'. However due to the implementation details, the results we got from sklearn are still a little bit different from the results produced by our naive codes.
from sklearn.neighbors import KNeighborsClassifier
clf = KNeighborsClassifier(n_neighbors=10, weights='uniform', algorithm='brute',
                             metric='euclidean')
clf.fit(X_train, y_train)
y_pred = ckf.predict(X_test)
2.1.6. Normalization#
Different features may have different scales. It might be unfair for those features that have small scales. Therefore usually it is better to rescale all the features to make them have similar scales. After examining all the data, we find the minimal value minVal and the range ranges for each column. The normalization formula is:
We could also convert the normalized number back to the original value by
The sample codes are listed below.
def encodeNorm(X, parameters=None):
    # parameters contains minVals and ranges
    if parameters is None:
        minVals = np.min(X, axis=0)
        maxVals = np.max(X, axis=0)
        ranges = np.maximum(maxVals - minVals, np.ones(minVals.size))
        parameters = {'ranges': ranges, 'minVals': minVals}
    else:
        minVals = parameters['minVals']
        ranges = parameters['ranges']
    Nmat = np.tile(minVals, (X.shape[0], 1))
    Xnorm = (X - Nmat)/ranges
    return (Xnorm, parameters)


def decodeNorm(X, parameters):
    # parameters contains minVals and ranges
    ranges = parameters['ranges']
    minVals = parameters['minVals']
    Nmat = np.tile(minVals, (X.shape[0], 1))
    Xoriginal = X * ranges + Nmat
    return Xoriginal