Exercises and Projects
3.5. Exercises and Projects#
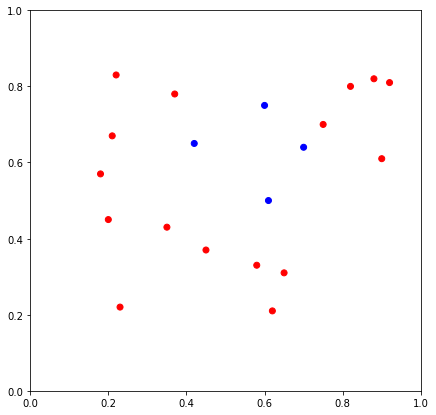
Exercise 3.1
The dataset and its scattering plot is given below.
Please calculate the Gini impurity of the whole set by hand.
Please apply CART to create the decision tree by hand.
Please use the tree you created to classify the following points:
\((0.4, 1.0)\)
\((0.6, 1.0)\)
\((0.6, 0)\)
The following code is for ploting. You may also get the precise data points by reading the code. You don’t need to write codes to solve the problem.
import pandas as pd
import matplotlib.pyplot as plt
data = {'x0': [0.22, 0.37, 0.42, 0.45, 0.18, 0.20, 0.21, 0.23, 0.35, 0.58,
               0.60, 0.61, 0.62, 0.65, 0.70, 0.75, 0.82, 0.88, 0.90, 0.92],
        'x1': [0.83, 0.78, 0.65, 0.37, 0.57, 0.45, 0.67, 0.22, 0.43, 0.33,
               0.75, 0.50, 0.21, 0.31, 0.64, 0.70, 0.80, 0.82, 0.61, 0.81],
        'y': ['r', 'r', 'b', 'r', 'r', 'r', 'r', 'r', 'r', 'r',
              'b', 'b', 'r', 'r', 'b', 'r', 'r', 'r', 'r', 'r']}
df = pd.DataFrame(data)

plt.figure(figsize=(7, 7))
plt.scatter(df['x0'], df['x1'], c=df['y'])
_ = plt.xlim(0, 1)
_ = plt.ylim(0, 1)
Exercise 3.2
CHOOSE ONE: Please apply the Decision Tree to one of the following datasets.
dating dataset (in Chpater 2).
the
titanicdataset.
Please answer the following questions.
Please use grid search to find the good
max_leaf_nodesandmax_depth.Please record the accuracy (or cross-validation score) of your model and compare it with the models you learned before (kNN).
Please find the two most important features and explane your reason.
(Optional) Use the two most important features to draw the Decision Boundary if possible.